

You have a website, and you know people are visiting it. But who are they, and what are they looking for? It often feels like you’re just guessing.
You need real answers, not just hunches, to grow your business. This is where a powerful free tool called Google Analytics comes into play. It helps you stop guessing and start knowing what is actually happening on your website, taking your lead management to the next level with LeadBranch!
Making sense of the data from Google Analytics is the first step to truly understanding your online audience. The insights you gather are foundational for making smarter business decisions.
Table Of Contents:
- So What Exactly is Google Analytics?
- How Does This Whole Google Analytics Thing Work?
- The Best Features Hiding Inside Google Analytics
- Making Sense of Google Analytics Reports
- Key Metrics You Absolutely Need to Know
- The Big Shift to Google Analytics 4 (GA4)
- Supercharging Your Data with the Right Integrations
So What Exactly is Google Analytics?
Think of Google Analytics as your website’s personal detective. It is a free service from Google that gathers statistics about your visitors. It shows you how people find your site and how they interact with it once they arrive.
The platform is built to track the performance of your web property and give you real visitor insights. This information is pure gold for your marketing efforts. You can see which campaigns are working and which ones are falling flat.
Small and large businesses use it to understand customer behavior. For example, it can show you the path someone took before making a purchase. This anonymous data reveals what a user did on your site.
While it tells you a user clicked a button, it cannot tell you who that person is. This is where you see the limits of analytics alone. Combining it with a detailed customer database like LeadBranch can fill in those personal details.
How Does This Whole Google Analytics Thing Work?
Getting it to work is simpler than you might think. You do not need to be a coding wizard. You just add a small piece of JavaScript code to each page of your website.
This little snippet is called a tracking code. Every time someone visits a page, this code collects anonymous information. It notes things like the visitor’s browser, their language, and what device they are using.
It also tracks how they got to your site. Did they arrive from a Google search, a social media link, or by typing in your website URL directly? The code gathers all this information and sends it to your Google Analytics account for processing.
The entire system relies on cookies to function properly. This means it will not be able to collect data from visitors who have cookies disabled in their browsers.
The Best Features Hiding Inside Google Analytics
Google Analytics is packed with features that can give you a clearer picture of your audience and their journey. You can get a sense of how people are interacting with your digital front door. Here are some of the most helpful tools inside:
- Automated Insights: Google uses its machine learning smarts to automatically find important trends in your data. It might point out that traffic from a specific city has shot up, saving you the time of finding it yourself. This happens because analytics automatically looks for anomalies and emerging patterns.
- Funnel Exploration: This tool is amazing for seeing the steps people take to complete a goal on your site. You can see exactly where they drop off in the process of signing up for a newsletter or buying a product. The data from this can be used to generate a detailed exploration report.
- Path Exploration: Similar to funnels, this feature shows the twisting paths users take as they move through your site. You can see what they do before and after a key action, like viewing a product page. This helps you understand common user flows and identify unexpected behavior.
- Custom Reports: While the standard reports are great, you can also build custom reports from scratch. This allows you to pick the exact dimensions and metrics that matter most to your business. You can focus only on the data relevant to your specific goals.
- Segment Overlap: You can create different groups of users, called segments, based on their behavior or demographics. This feature lets you see how those groups overlap. For instance, you could see how many mobile users also came from your latest ad campaign.
- Advertising Workspace: If you run online ads, this is your command center. It helps you see how your ad spending across different channels is performing. This kind of analytics integration brings all your campaign data into one place for easier analysis.
These features give you a strong foundation. When you are ready to act on these insights, a tool like LeadBranch can help you reach those exact segments you have discovered with targeted messages.
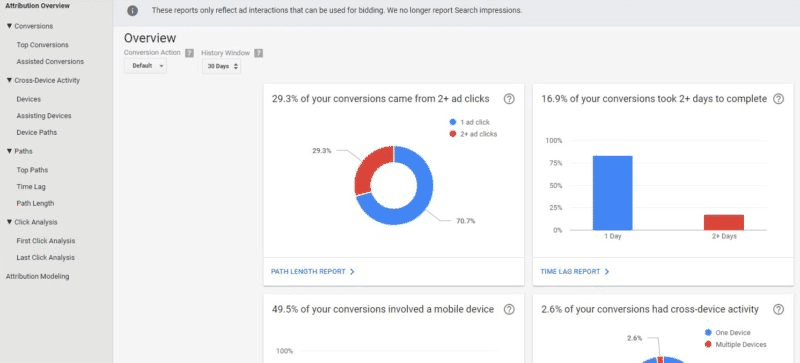
Making Sense of Google Analytics Reports
The real power of this tool lies in its reports. This is where all that data gets turned into easy-to-read charts and graphs. Getting familiar with the main report types will change how you view your website.
Real-Time Reports
Just like the name says, this report shows you what is happening on your website right now. You can see how many people are active, which pages they are on, and where they are coming from. It is useful for tracking the immediate impact of a new blog post or social media blast.
You can also use it for testing. For instance, if you are checking if your tracking code is working on a new page, you can visit the page and watch yourself show up in the real-time report.
Acquisition Reports
This is all about how you get visitors. An acquisition report breaks down your traffic sources. You learn how many people come from organic search, paid ads, social media, or by directly typing in your URL.
This information helps you focus your marketing efforts where they count most. By looking at the Source and Medium dimensions, you can see if your efforts on Google, Facebook, or email marketing are paying off. This is a critical report for measuring marketing ROI.
Engagement Reports
Once people are on your site, what do they do? The engagement reports answer that question. You can identify your most popular pages, see how long people stay, and track the specific actions they take.
Metrics like Engaged Sessions show you which visits involved a meaningful interaction, not just a quick glance and a click away. You can also see which pages hold visitors’ attention the longest. This helps you figure out what content resonates most with your audience.
Monetization Reports
If you sell products or services online, this is where you will spend a lot of time. Monetization reports show you the revenue your site or app is generating. You can see which products sell best and how your marketing activities translate into actual sales.
These reports can track everything from total revenue to average purchase value. You can also see the path customers take before they buy. This data is essential for optimizing your sales funnel and improving your bottom line.
These reports give you the what, the when, and the where. To truly grow, you need the who. That is why many businesses use insights from Google Analytics to build campaigns in LeadBranch, letting them target specific demographics.
Key Metrics You Absolutely Need to Know
You will come across many terms and numbers inside your reports. To avoid getting overwhelmed, you should focus on a few key metrics first. Think of these as the vital signs of your website’s health.
A metric is a number, like the number of visitors. A dimension is what you measure that metric by, like the city a visitor is from. So you could look at the metric ‘Users’ by the dimension ‘City’ to see how many visitors you got from New York.
Here are some of the most important metrics to watch, explained in a simple table:
| Metric | What It Means | Why It Matters |
|---|---|---|
| Users | The total number of individual people who visited your site. | This shows the overall size of your audience during a specific time. |
| Sessions | A group of interactions a user takes on your site. One user can have multiple sessions. | Sessions help you understand how often people are returning to and engaging with your content. |
| Engaged Sessions | A session that lasted longer than 10 seconds, had a conversion event, or had at least 2 pageviews. | This GA4 metric is better than bounce rate because it measures positive interaction, not just a lack of it. |
| Engagement Rate | The percentage of sessions that were engaged sessions. | A high engagement rate means visitors are finding your content valuable and interacting with it. |
| Average Engagement Time | The average time your website was the main focus in a user’s browser. | This shows how long you are actively holding your audience’s attention, a key sign of quality content. |
| Conversions | The number of times visitors completed a specific action you want them to take (formerly Goals). | This is a big one. It directly measures how well your site is achieving its objectives, like sales or lead generation. |
The Big Shift to Google Analytics 4 (GA4)
You may have heard about Google Analytics 4, or GA4. This is the latest version of the platform and a big change from the older Universal Analytics. Google has now made GA4 the standard for any new web property.
The biggest difference is how it tracks data. The old version was based on sessions and pageviews. GA4 is based on events, where an event can be anything from a page view to a button click to a video play.
This new event-based model is much more flexible. It gives you a better view of the entire customer journey, even across different devices. GA4 also moves away from a reliance on third-party cookies by using machine learning to fill in data gaps.
Another major change is the focus on privacy. GA4 comes with stronger privacy features built in, like not storing a user’s IP address by default. This change helps businesses adapt to a more privacy-conscious web.
Supercharging Your Data with the Right Integrations
Google Analytics is incredibly powerful on its own. It becomes even more useful when you connect it to other tools. A successful Google Analytics integration can give you a much fuller picture of your marketing and business performance.
For example, you can link Google Analytics with your Google Ads account. This lets you see how your ad clicks translate into website behavior. You can also set up an analytics integration with the Google Search Console to understand which search terms bring people to your site.
This is how smart businesses operate. They take the behavioral data from Google Analytics, which shows them that a certain segment of users visits the pricing page multiple times. Then they take that insight to a platform like LeadBranch.
With LeadBranch, they can filter their own customer list to find people who match that segment’s demographics. They can target users by age, marital status, or nationality. Now you have a powerful, targeted list ready for action.
LeadBranch lets you use features like timezone-aware SMS messaging and lead qualification. You can use its database to clean your existing data or find new leads that fit your ideal profile. It turns anonymous website data into real conversations with potential customers.
Ready to move beyond basic analytics and start connecting with the real people behind the clicks? Check out how LeadBranch can help you filter, clean, and engage your leads based on detailed demographic data. It is time to combine what they do with who they are!
Conclusion
Wading through website data can feel complicated at first. By using Google Analytics, you are taking a huge step toward making informed decisions. You replace guesswork with actual facts about your audience.
Start with the basics, like understanding your main traffic sources and most popular content. As you get more comfortable, you can explore more advanced features like custom reports. The goal is to turn this data from your Google Analytics account into actions that improve your website.
Ultimately, this process will help you grow your business. The best strategy is often using this data in harmony with other powerful platforms to get a complete customer view and make confident business decisions.